This article covers the Assessment Completion Time section in the Analytics tabs in the HighMatch app.
You can see how long candidates typically take to finish an assessment. Visuals like histograms and box plots help you spot typical completion ranges, compare times across devices, and identify unusually fast or slow patterns that may affect completion rates and the candidate experience.
This section is one of six metric sections in the Analytics tab.
If you would like more information on any of the other sections, please click on any of the following links:
- Assessment Engagement & Scores
- Assessment Section Abandonment
- Assessment Section Completion Time
- Invitation Engagement
- Report Engagement

Metric Summary & Data Points
This metric visualizes how long candidates take to complete a specific assessment. It provides insights into the assessment’s time commitment and helps evaluate its potential impact on completion rates.
Definitions of the data points presented in this metric include:
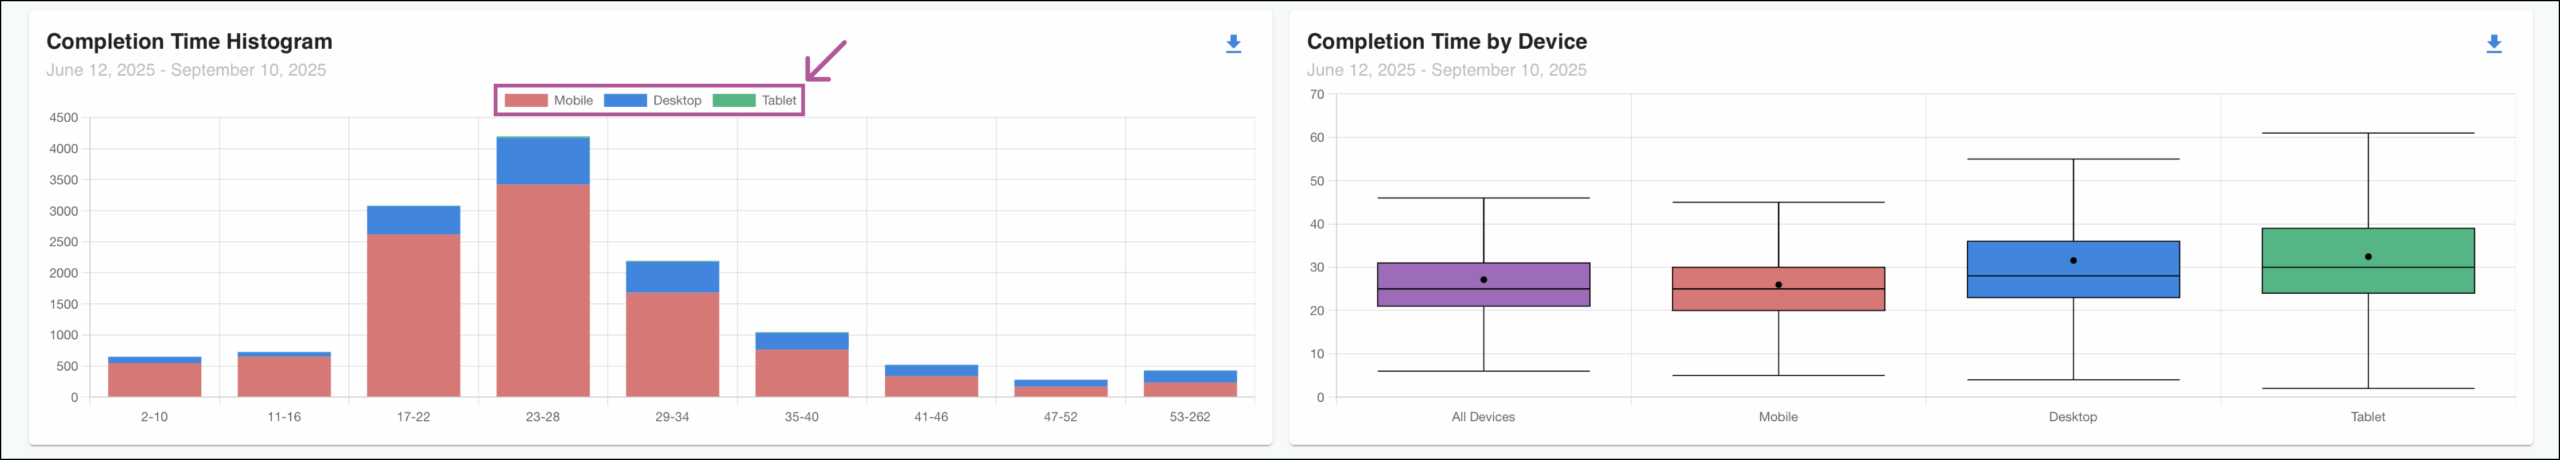
- Histogram: Shows distribution of time-to-complete across all time completion ranges.
- Box Plots: Displays the following time patterns for the categories: All Devices, Mobile, Desktop, and Tablet.
- Typical Faster Time: The time range in which faster participants typically finish. This represents the 25th percentile (Q1) — the point where 25% of participants will finish faster than.
- Median Time: The time where half of the participants finished faster than.
- Average Time: The average time taken by all participants. While useful, it can be affected by extreme cases.
- Typical Slower Time: The time range in which slower participants typically finish. This marks the 75th percentile (Q3) — the point where 75% of participants will finish faster than.
The completion time histogram shows how many participants finished the assessment within various time ranges to see where most candidates cluster and to highlight any unusually fast or slow completion times.
The box plot breaks this down by device type, making it easy to compare slow, medium, and fast timing average patterns across desktop, tablet, and mobile.
Summary cards will also be available showing the percentages along with small bar charts for comparison across devices.
How to Access & Use
To access this metric:
- Log in to your HighMatch account.
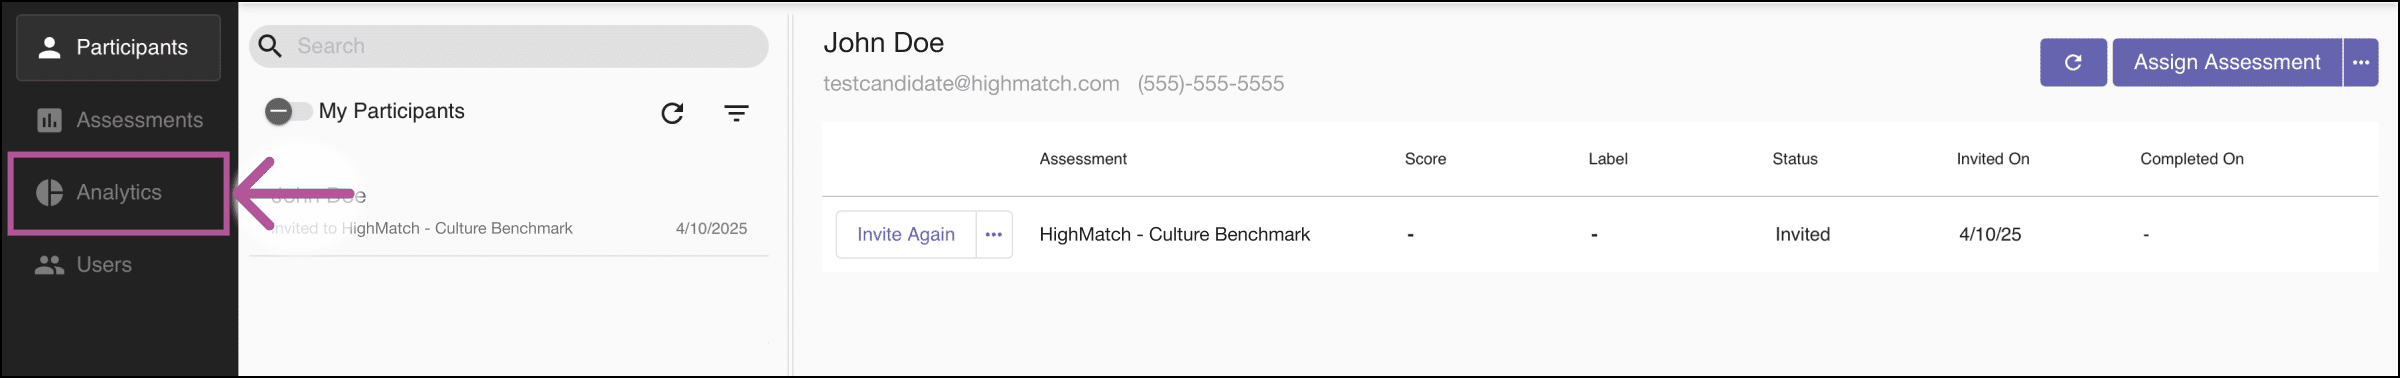
- Click the Analytics tab on the side menu located on the left-hand side of the screen.
- Click the Metric drop-down menu > Select Assessment Completion Time.

Here you will have several options to view, filter, and download data:

- Explain: Clicking the Explain button will display a metric summary and data points definitions similar to the Metric Summary & Data Points section above.
- Assessment: Allows you to select and filter by individual assessments.
- Date Range: Provides several options to filter the data by any date range:
- Text field: Here you may enter the date range manually.
- Quick Select: Below the text field, quickly filter by selecting one of the preselected data ranges.
- Relative to Today & Fixed Date Spans: Click the drop-down menu arrow to filter:
- Relative to Today: Select the amount of time to sort relative to the present day.
- Fixed Date Spans: Select one of several preselected and fixed date spans.
- Histogram Filters: You are given two options to view data on the chart.
- Hover: Hovering over any of the points on the x-axis on any of the charts will highlight the specific data for the specific point on the x-axis.
- Data Point Filter: You can toggle the data point filters by clicking them. When a filter is off, it will hide the data point on the chart.
- Box Plot Filters: You are given a similar option to view data on the histogram.
- Hover: Hovering over any boxes on the plot will highlight the specific data for that device type.
Exporting Data:
There are two ways to export data:
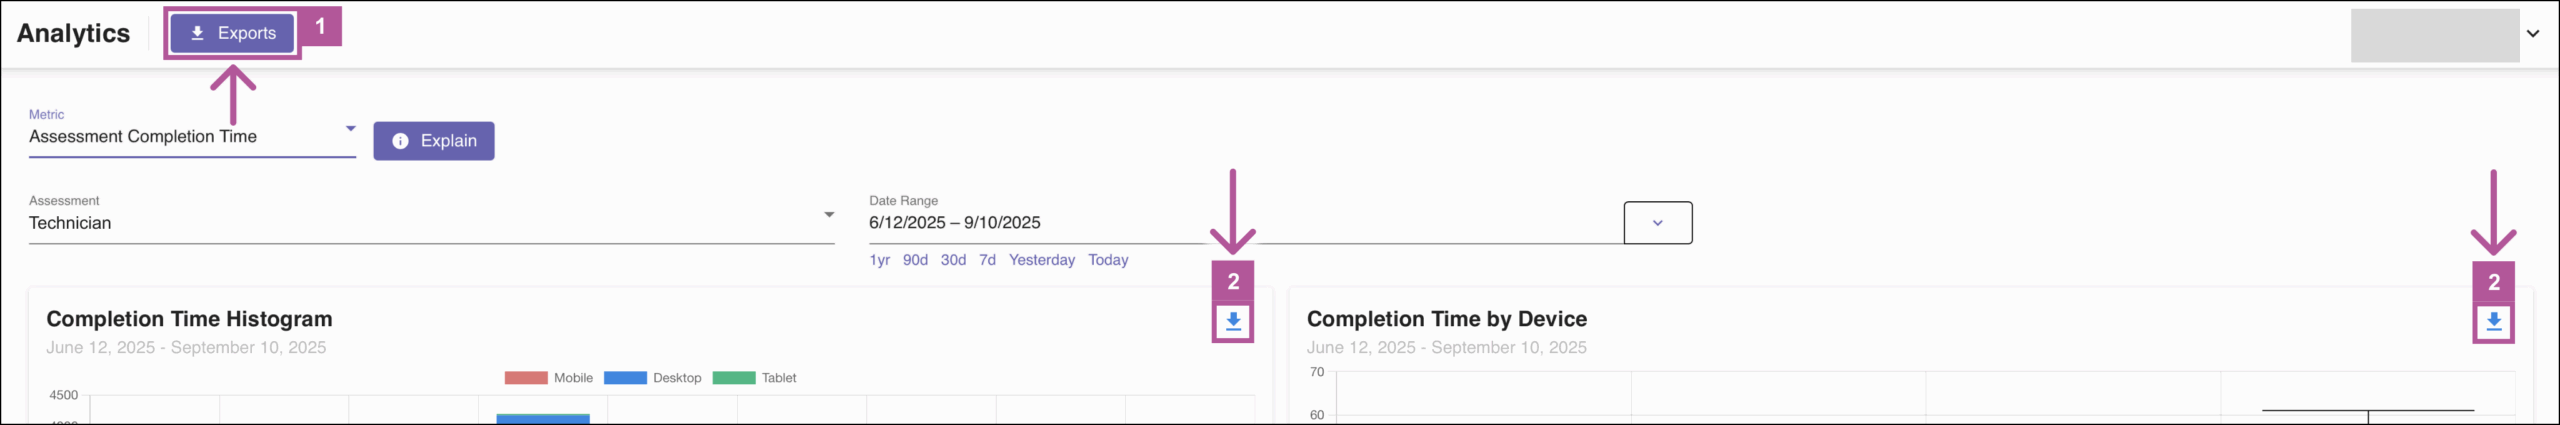
- Analytics | Exports: Clicking the Exports button will take you to the main export page, where you may export several types of data.
- Download (Charts): Clicking the Download icon on either chart will allow you to:
- Copy Chart to Clipboard: Allows you to copy the image of a chart and paste it into any document.
- Download Chart Image: Allows you to download an image of a chart.
- Download Chart Data as CSV: Allows you to download the data from a chart in a CSV file.