This article covers the Assessment Engagement & Scores section in the Analytics tabs in the HighMatch app.
You can quickly track the full assessment journey, including invitations sent, invitations redeemed, and assessments completed. You can also gain a quick understanding of candidate performance with scoring breakdowns.
This section is one of six metric sections in the Analytics tab.
If you would like more information on any of the other sections, please click on any of the following links:
- Assessment Completion Time
- Assessment Section Abandonment
- Assessment Section Completion Time
- Invitation Engagement
- Report Engagement
Metric Summary & Data Points
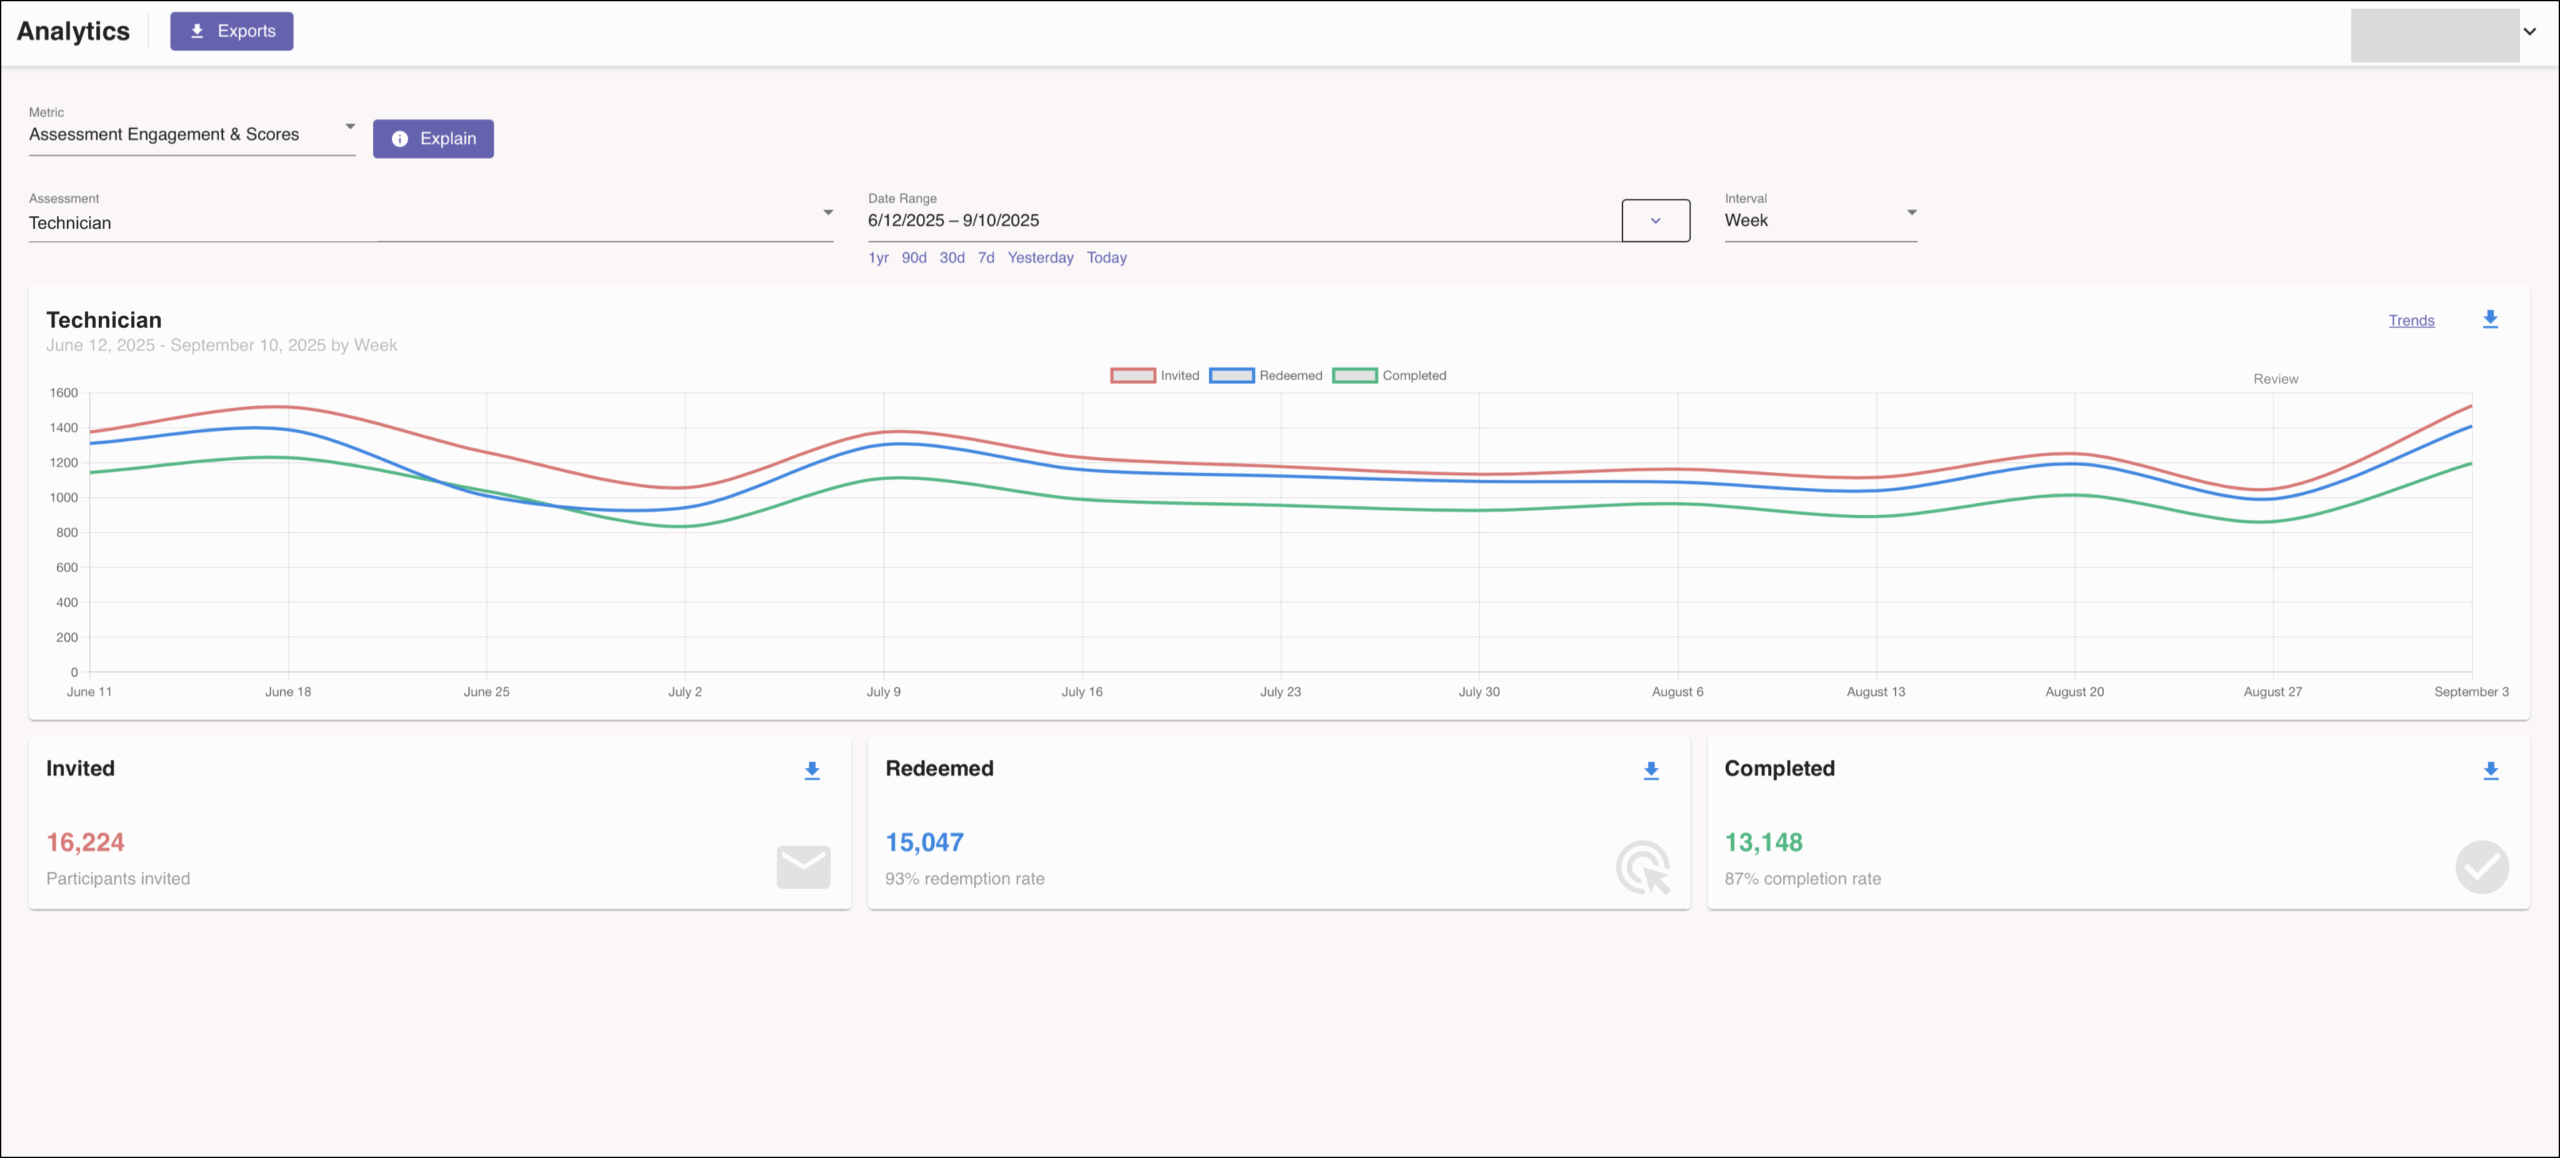
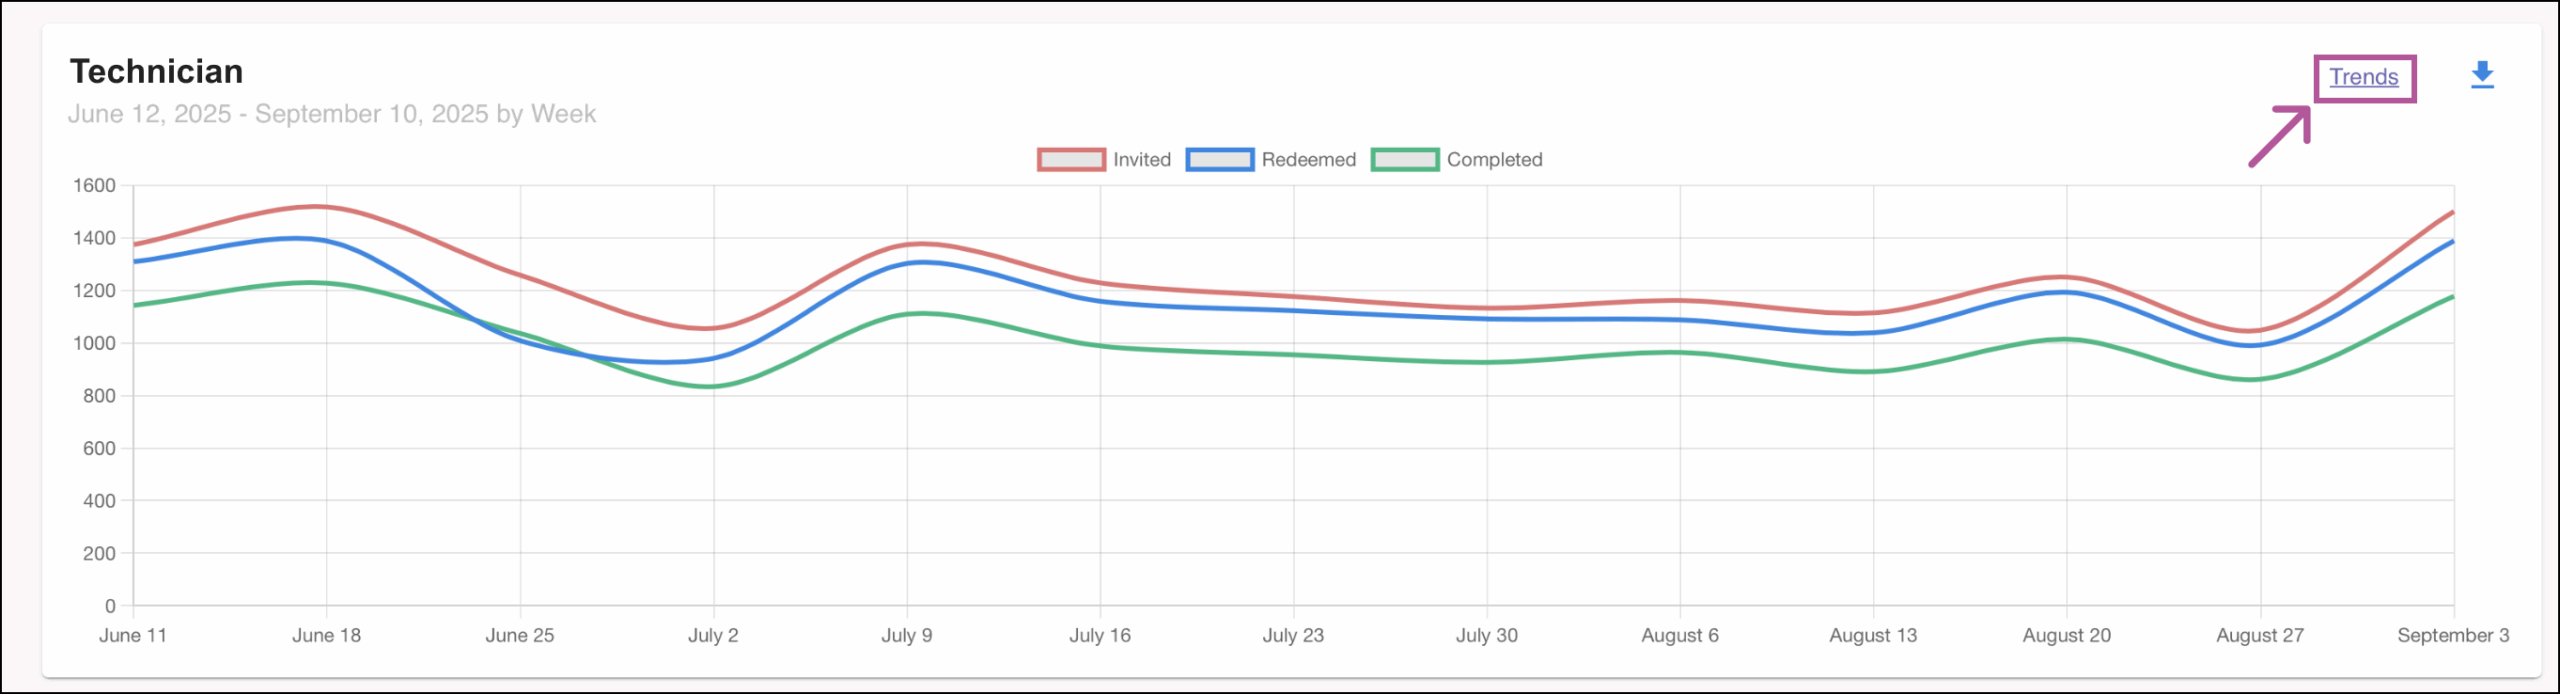
This metric presents the number of assessment invitations, invitation redemptions, and assessment completions over a period of time, along with the completed assessment score distribution, displaying both the number and percentage of participants that fall within each score label category.
Definitions of the data points presented in this metric include:
- Invited: When an assessment invitation was sent to a participant (first invitation only).
- Redeemed: When a participant opened and began the assessment (first open only).
- Completed: When a participant finished the assessment.
- Redeemed Rate: (Total Redemptions / Total Invitations) — shows the rate of participants starting an assessment.
- Completion Rate: (Total Completions / Total Redemptions) — shows the rate of participants completing an assessment.
- Score Distribution (when filtered by individual assessment): Results summarized by custom scoring buckets (e.g., “Recommended”) to show how well participants match job expectations.
By default, the All Assessments filter is selected, but you may filter by individual assessments.
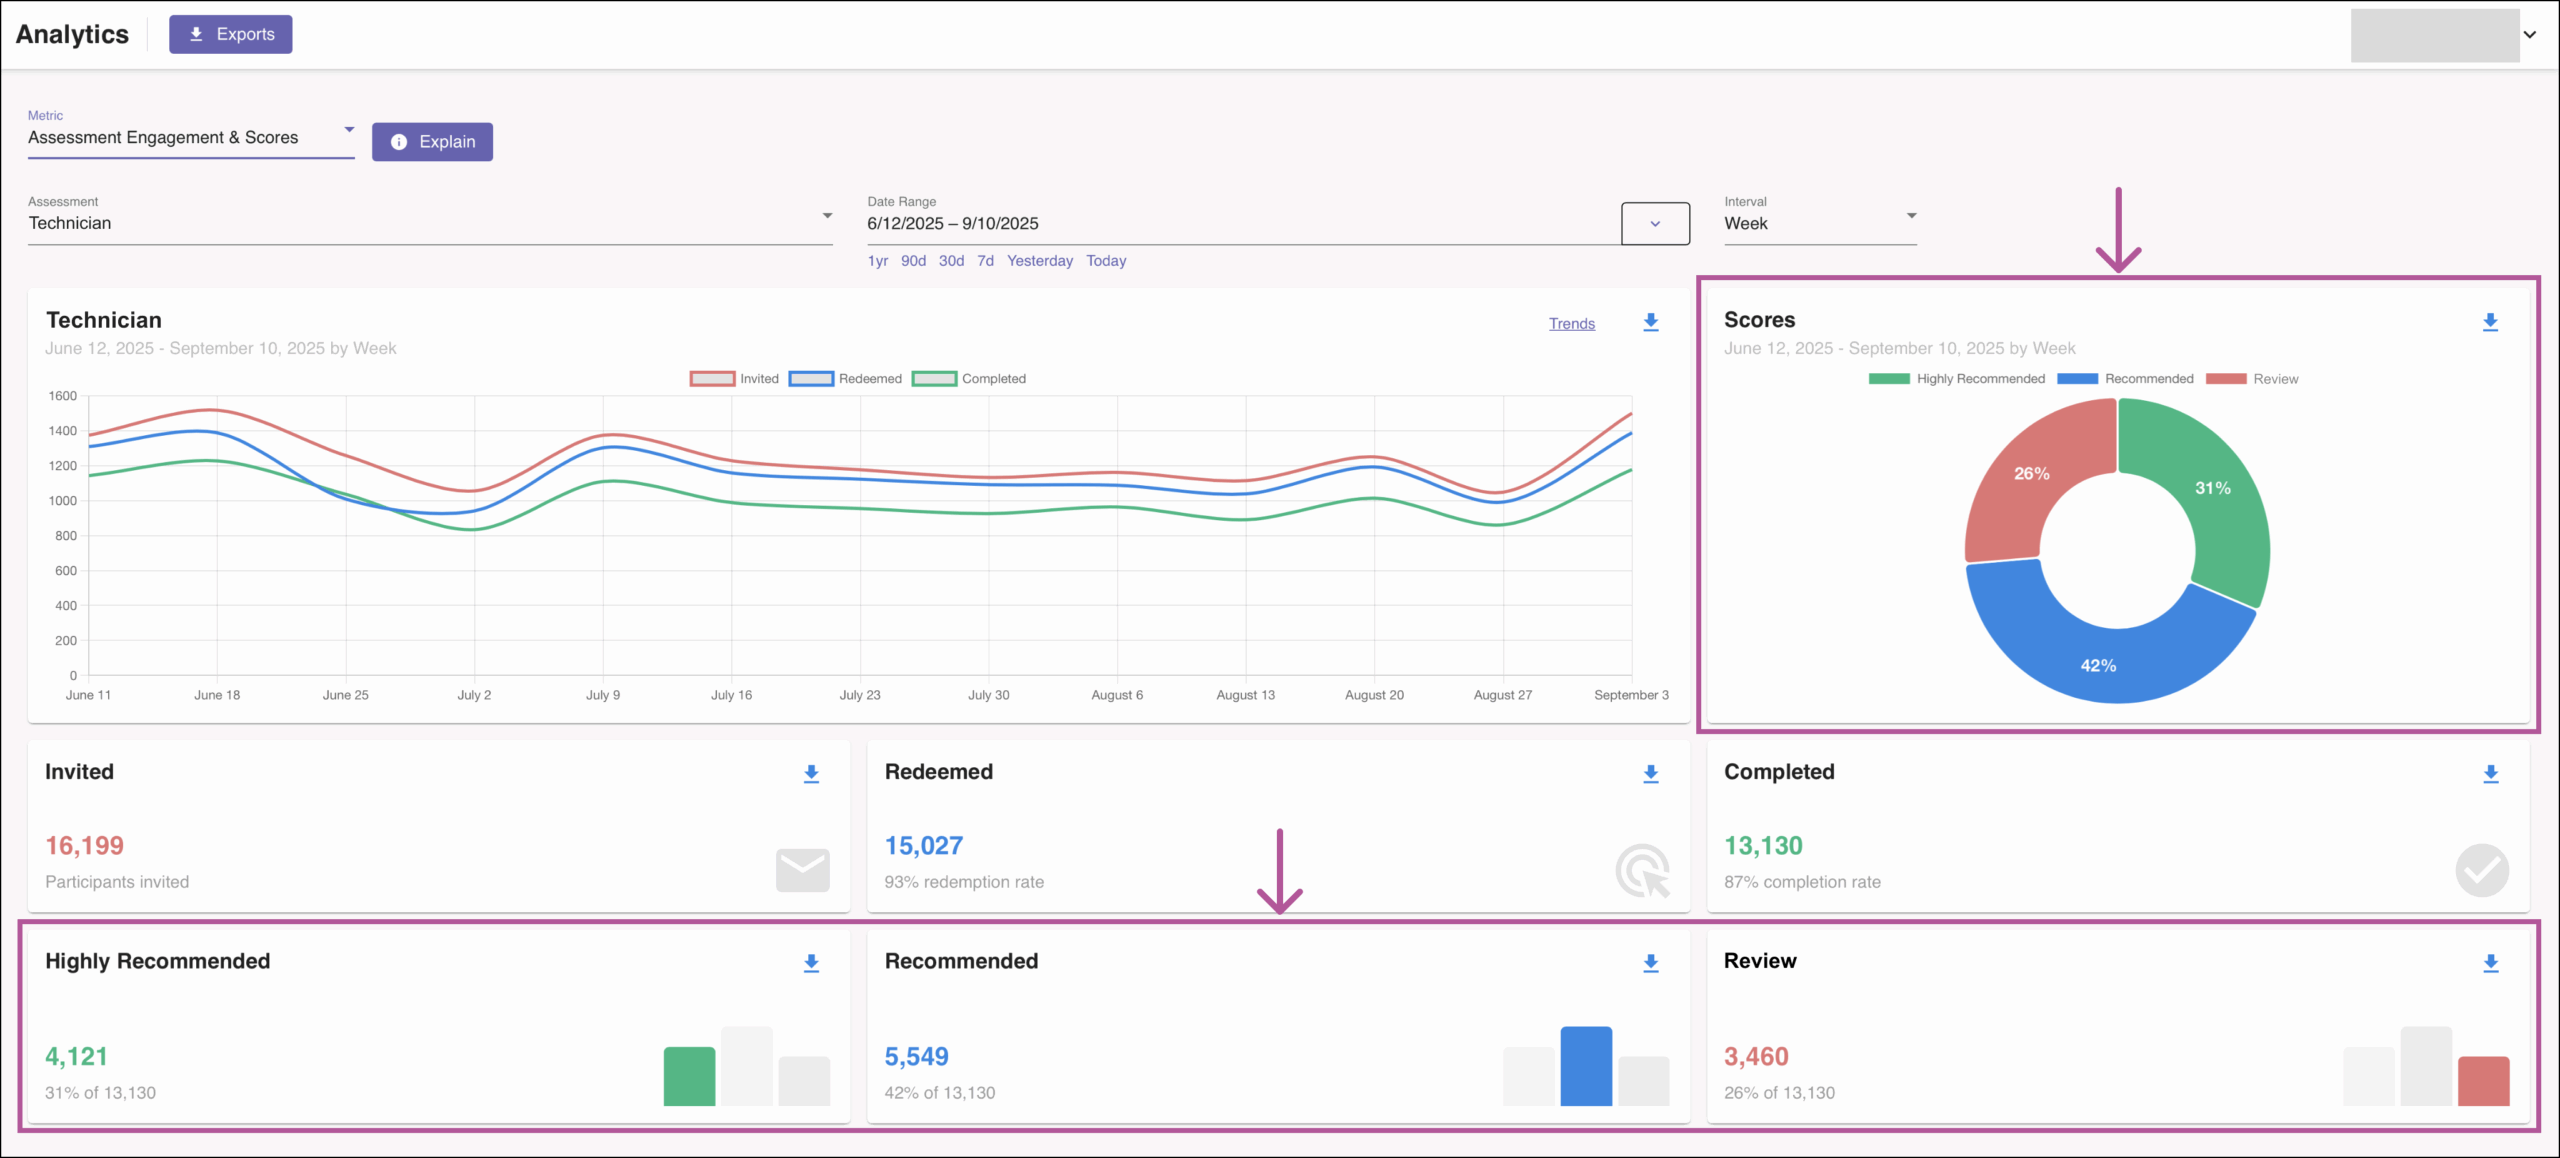
The All Assessment filter only displays the number of assessment invitations, invitation redemptions, and assessment completions. It includes summary cards for the total number of invites, invite redemptions, and completion rates.
Filtering by individual assessment will also display the score distribution donut chart illustrating the percentage of participants that fall within each assessment score label category. Summary cards will be displayed below the engagement statistics, showing the percentages along with small bar charts for comparison.
Note: Scoring labels can be changed from assessment to assessment; any scoring label shown in the screenshots may differ from your account.
How to Access & Use
To access this metric:
- Log in to your HighMatch account.
- Click the Analytics tab on the side menu located on the left-hand side of the screen.
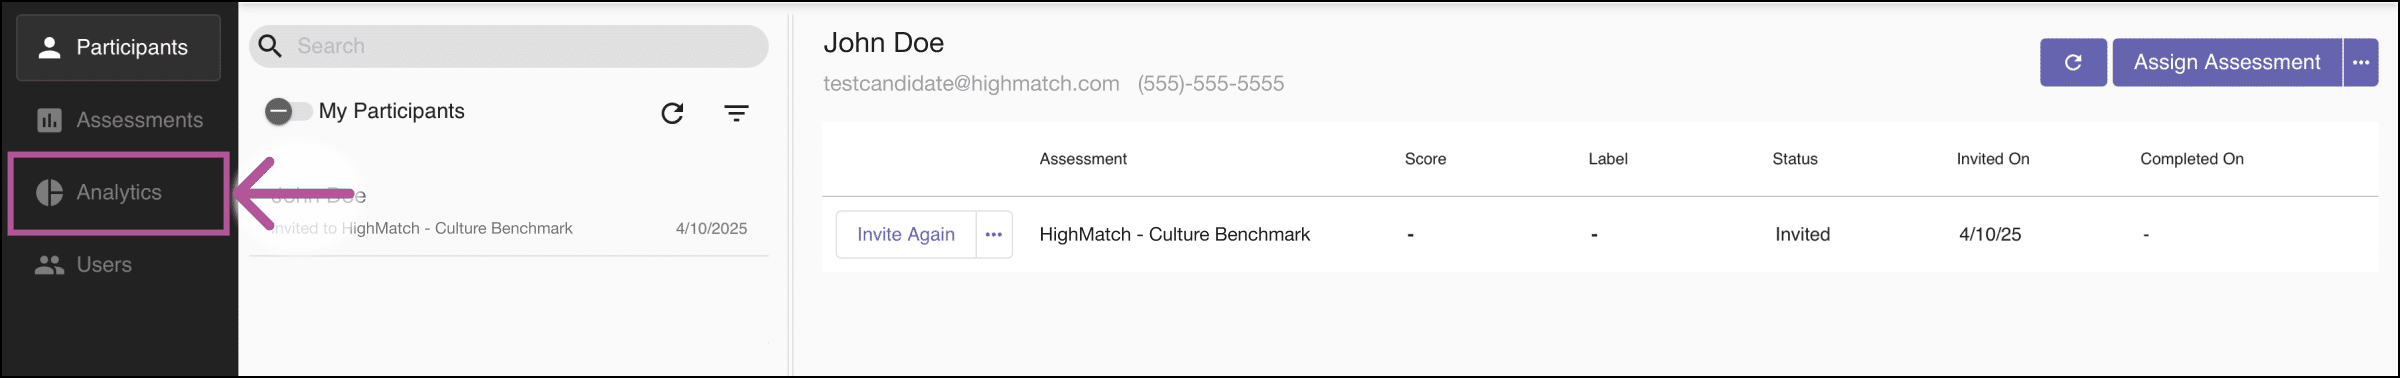
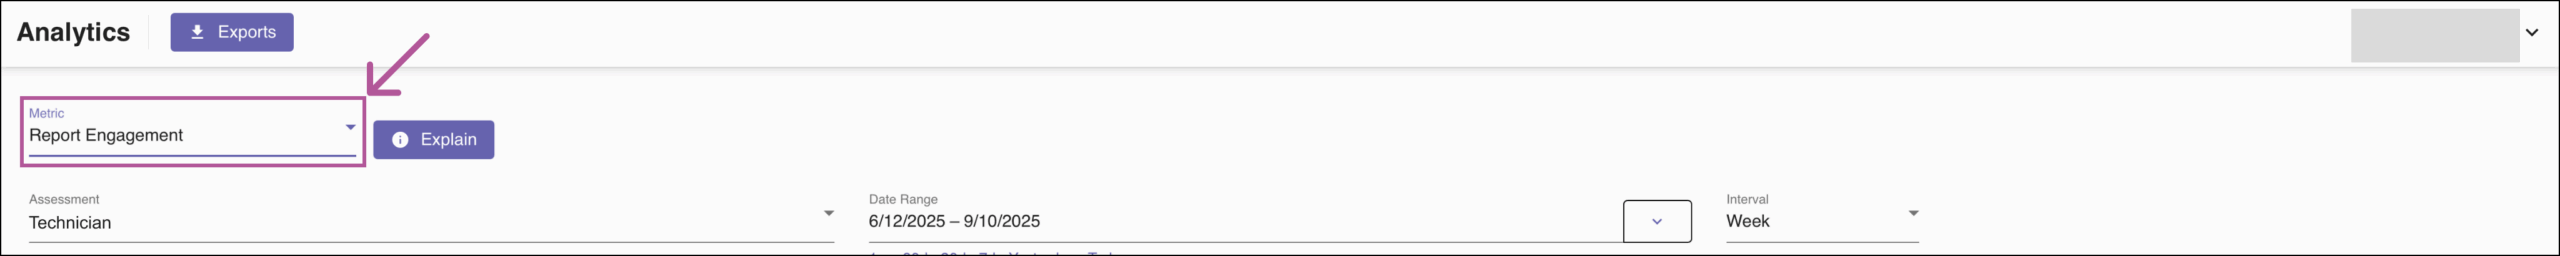
- Click the Metric drop-down menu > Select Assessment Engagement & Scores.
Here you will have several options to view, filter, and download data:
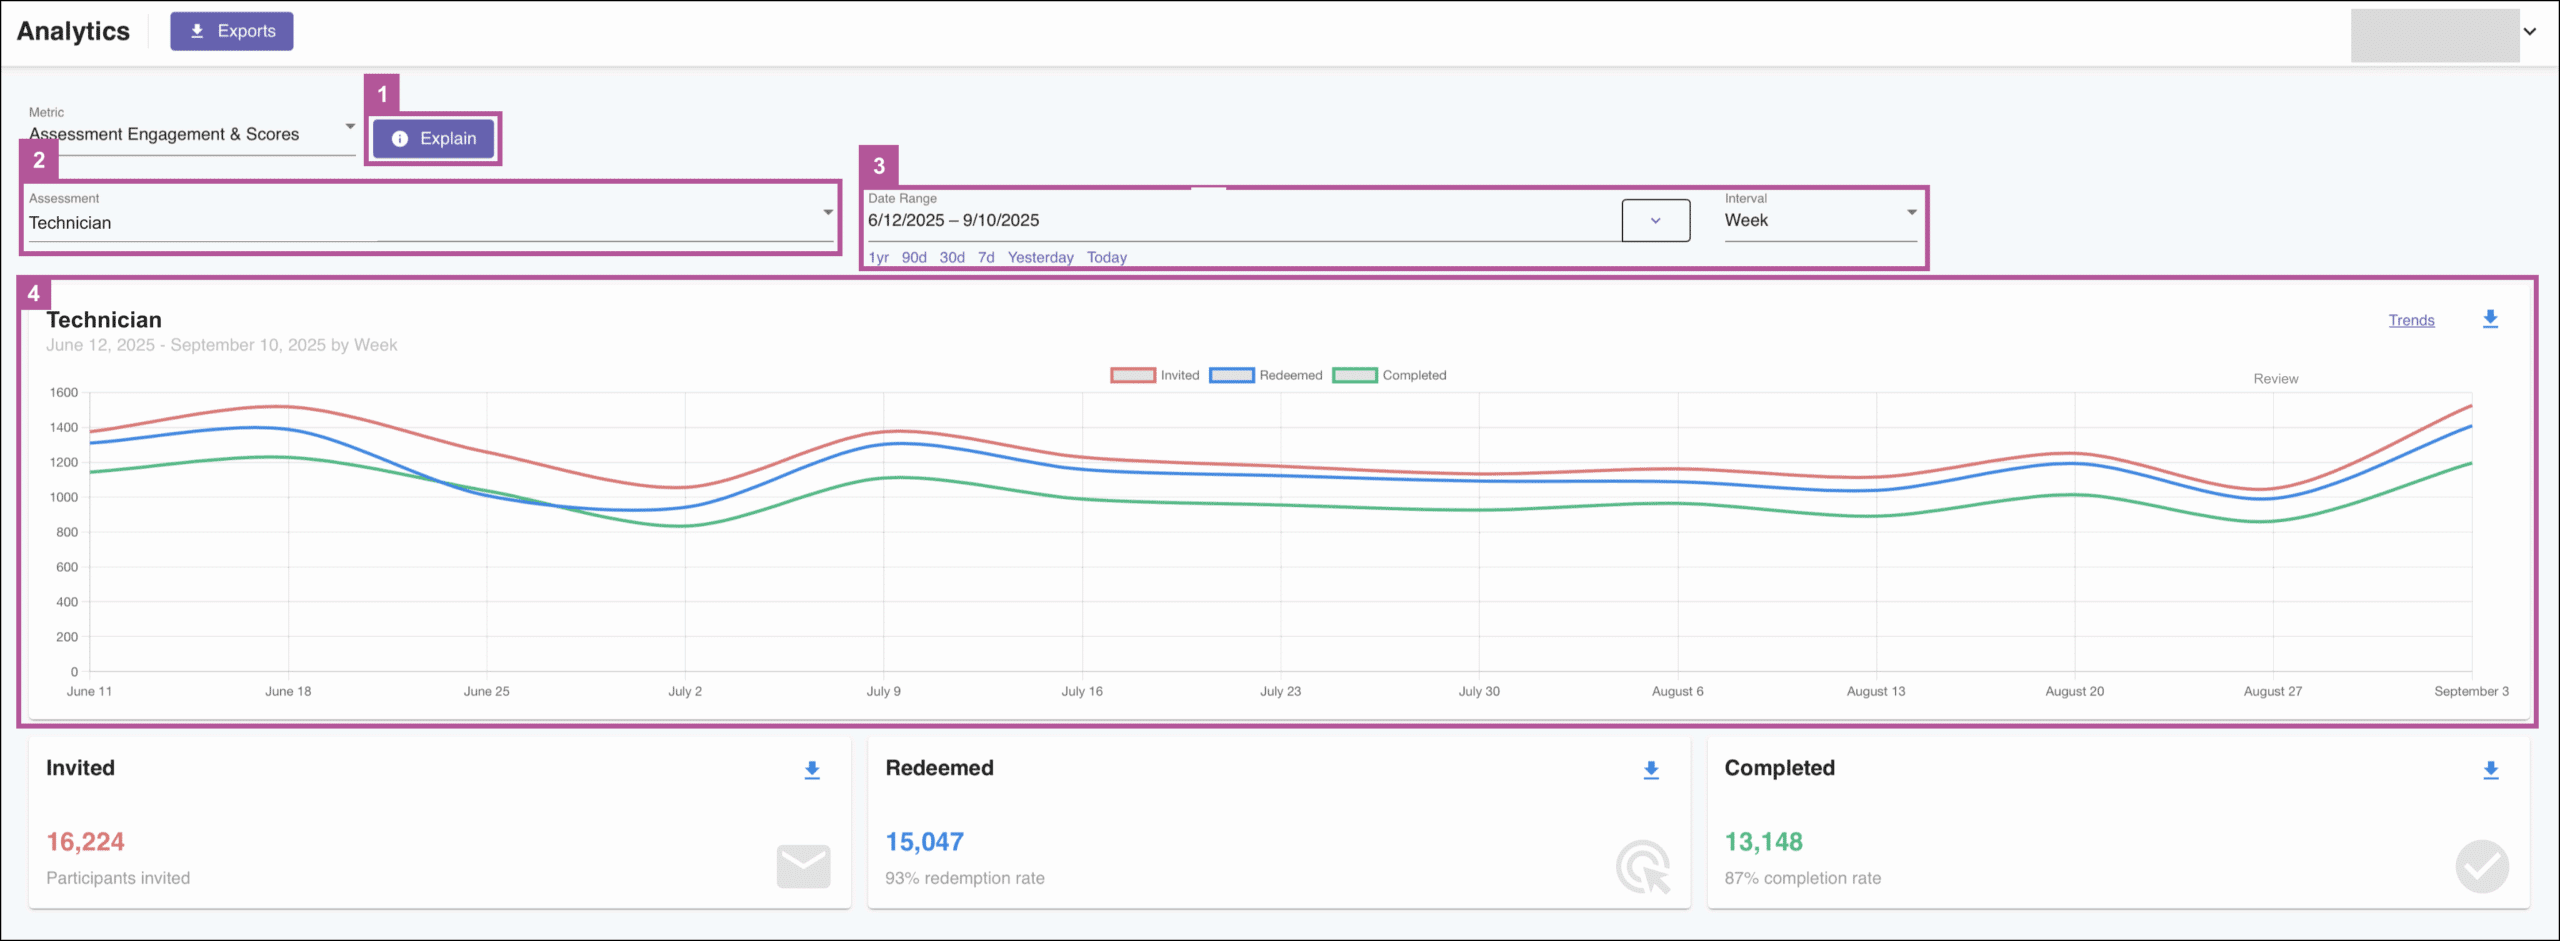
- Explain: Clicking the Explain button will display a metric summary and data points definitions similar to the Metric Summary & Data Points section above.
- Assessment: Allows you to select and filter by All Assessments or by individual assessments.
- Note: Selecting an individual assessment will cause the score distribution data to appear.
- Date Range: Provides several options to filter the data by any date range:
- Text field: Here you may enter the date range manually.
- Quick Select: Below the text field, quickly filter by selecting one of the preselected data ranges.
- Relative to Today & Fixed Date Spans: Click the drop-down menu arrow to filter:
- Relative to Today: Select the amount of time to sort relative to the present day.
- Fixed Date Spans: Select one of several preselected and fixed date spans.
- Interval: Select which date interval you would like to view the data in the chart: Day, Week, or Month.
- Chart Filters: You are given four options to view data on the chart.
- Hover: Hovering over any of the points on the x-axis (Date) on the charts will highlight the specific data for the specific point on the x-axis.
- Data Point Filter: You can toggle the data point filters by clicking them. When a filter is off, it will hide the data point on the chart.

- Trends: Clicking the Trends button will display the trending line for each of the data points on the chart.
- Zoom: To view data by hour intervals for a specific start and end date, click the required start date on the chart, drag your mouse to the right or left, and release when you reach your desired end date.
Selecting an individual assessment in the Assessment field will cause the score distribution donut chart and scoring summary cards to appear.
Note: The Date Range feature will also affect the Scores chart if used.
The options available on the score distribution donut chart are:
- Score Chart Filters: You are given two similar options to view data on the chart.
- Hover: Hovering over any point on the chart will highlight the specific data for that point.
- Data Point Filter: You can toggle the data point filters by clicking them. When a filter is off, it will hide the data point on the chart.

Exporting Data:
There are several ways to export data:
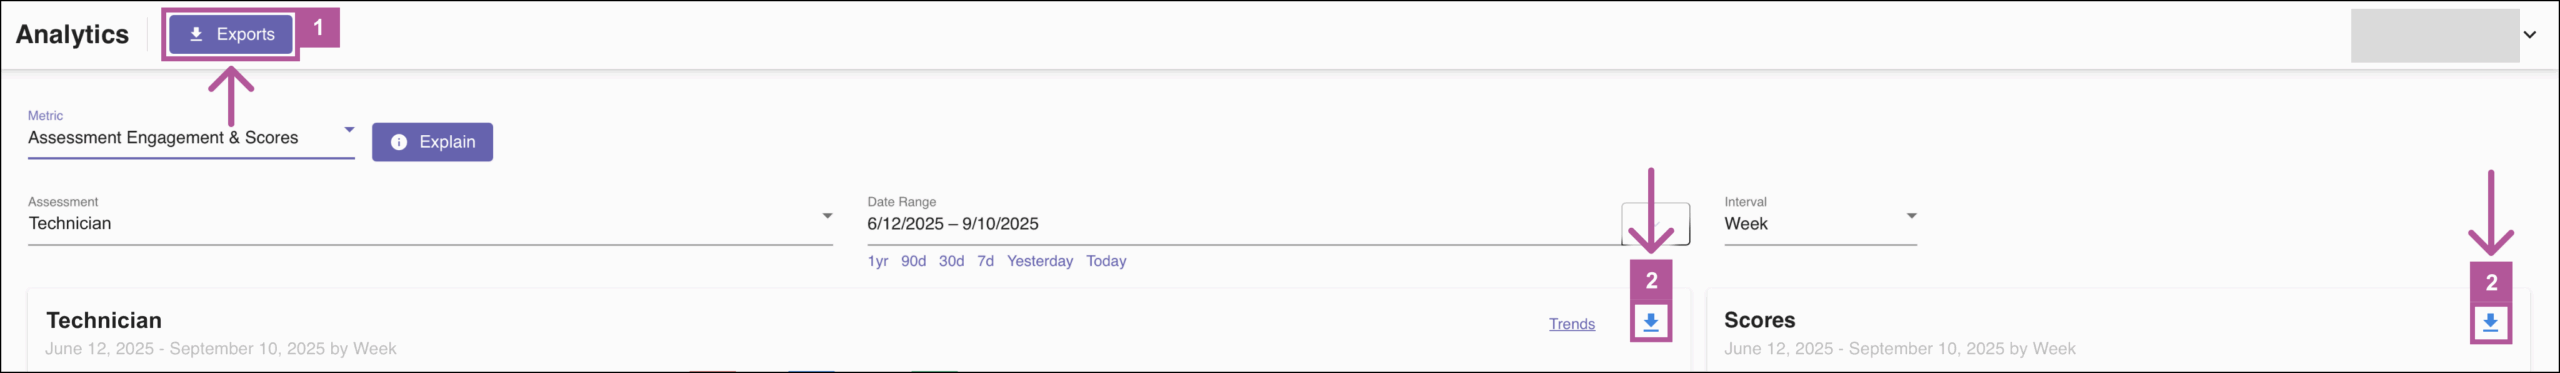
- Analytics | Exports: Clicking the Exports button will take you to the main export page, where you may export several types of data.
- Download (Charts): Clicking the Download icon on charts will allow you to:
- Copy Chart to Clipboard: Allows you to copy the image of a chart and paste it into any document.
- Download Chart Image: Allows you to download an image of a chart.
- Download Chart Data as CSV: Allows you to download the data from a chart in a CSV file.
- Download (Summary Cards): Clicking the Download icon on the following cards will allow you to download the following:
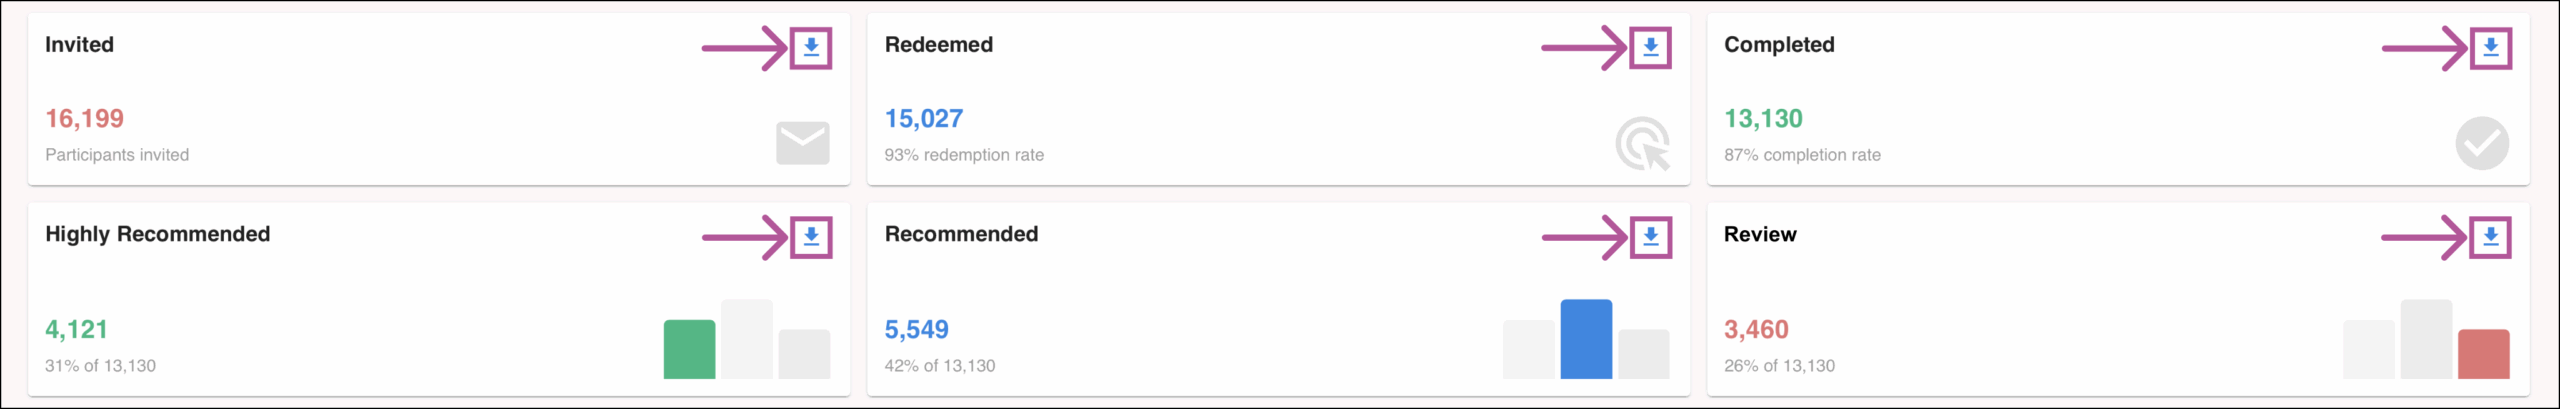
- Invited and Redeemed Summary Card: A CSV file of the Engagement Statistics data or Participant Activity data.
- Completed Summary Card: A CSV file of the Score and Item-level Response data, Engagement Statistics data, or Participant Activity data.
- Scoring Distribution Summary Cards: When the Scoring Distribution Summary Cards are visible, you will be able to download the following on each card:
- Copy Chart to Clipboard: Allows you to copy the image of a card and paste it into any document.
- Download Chart Image: Allows you to download an image of a card.
- Download Chart Data as CSV: Allows you to download the data from a card in a CSV file.