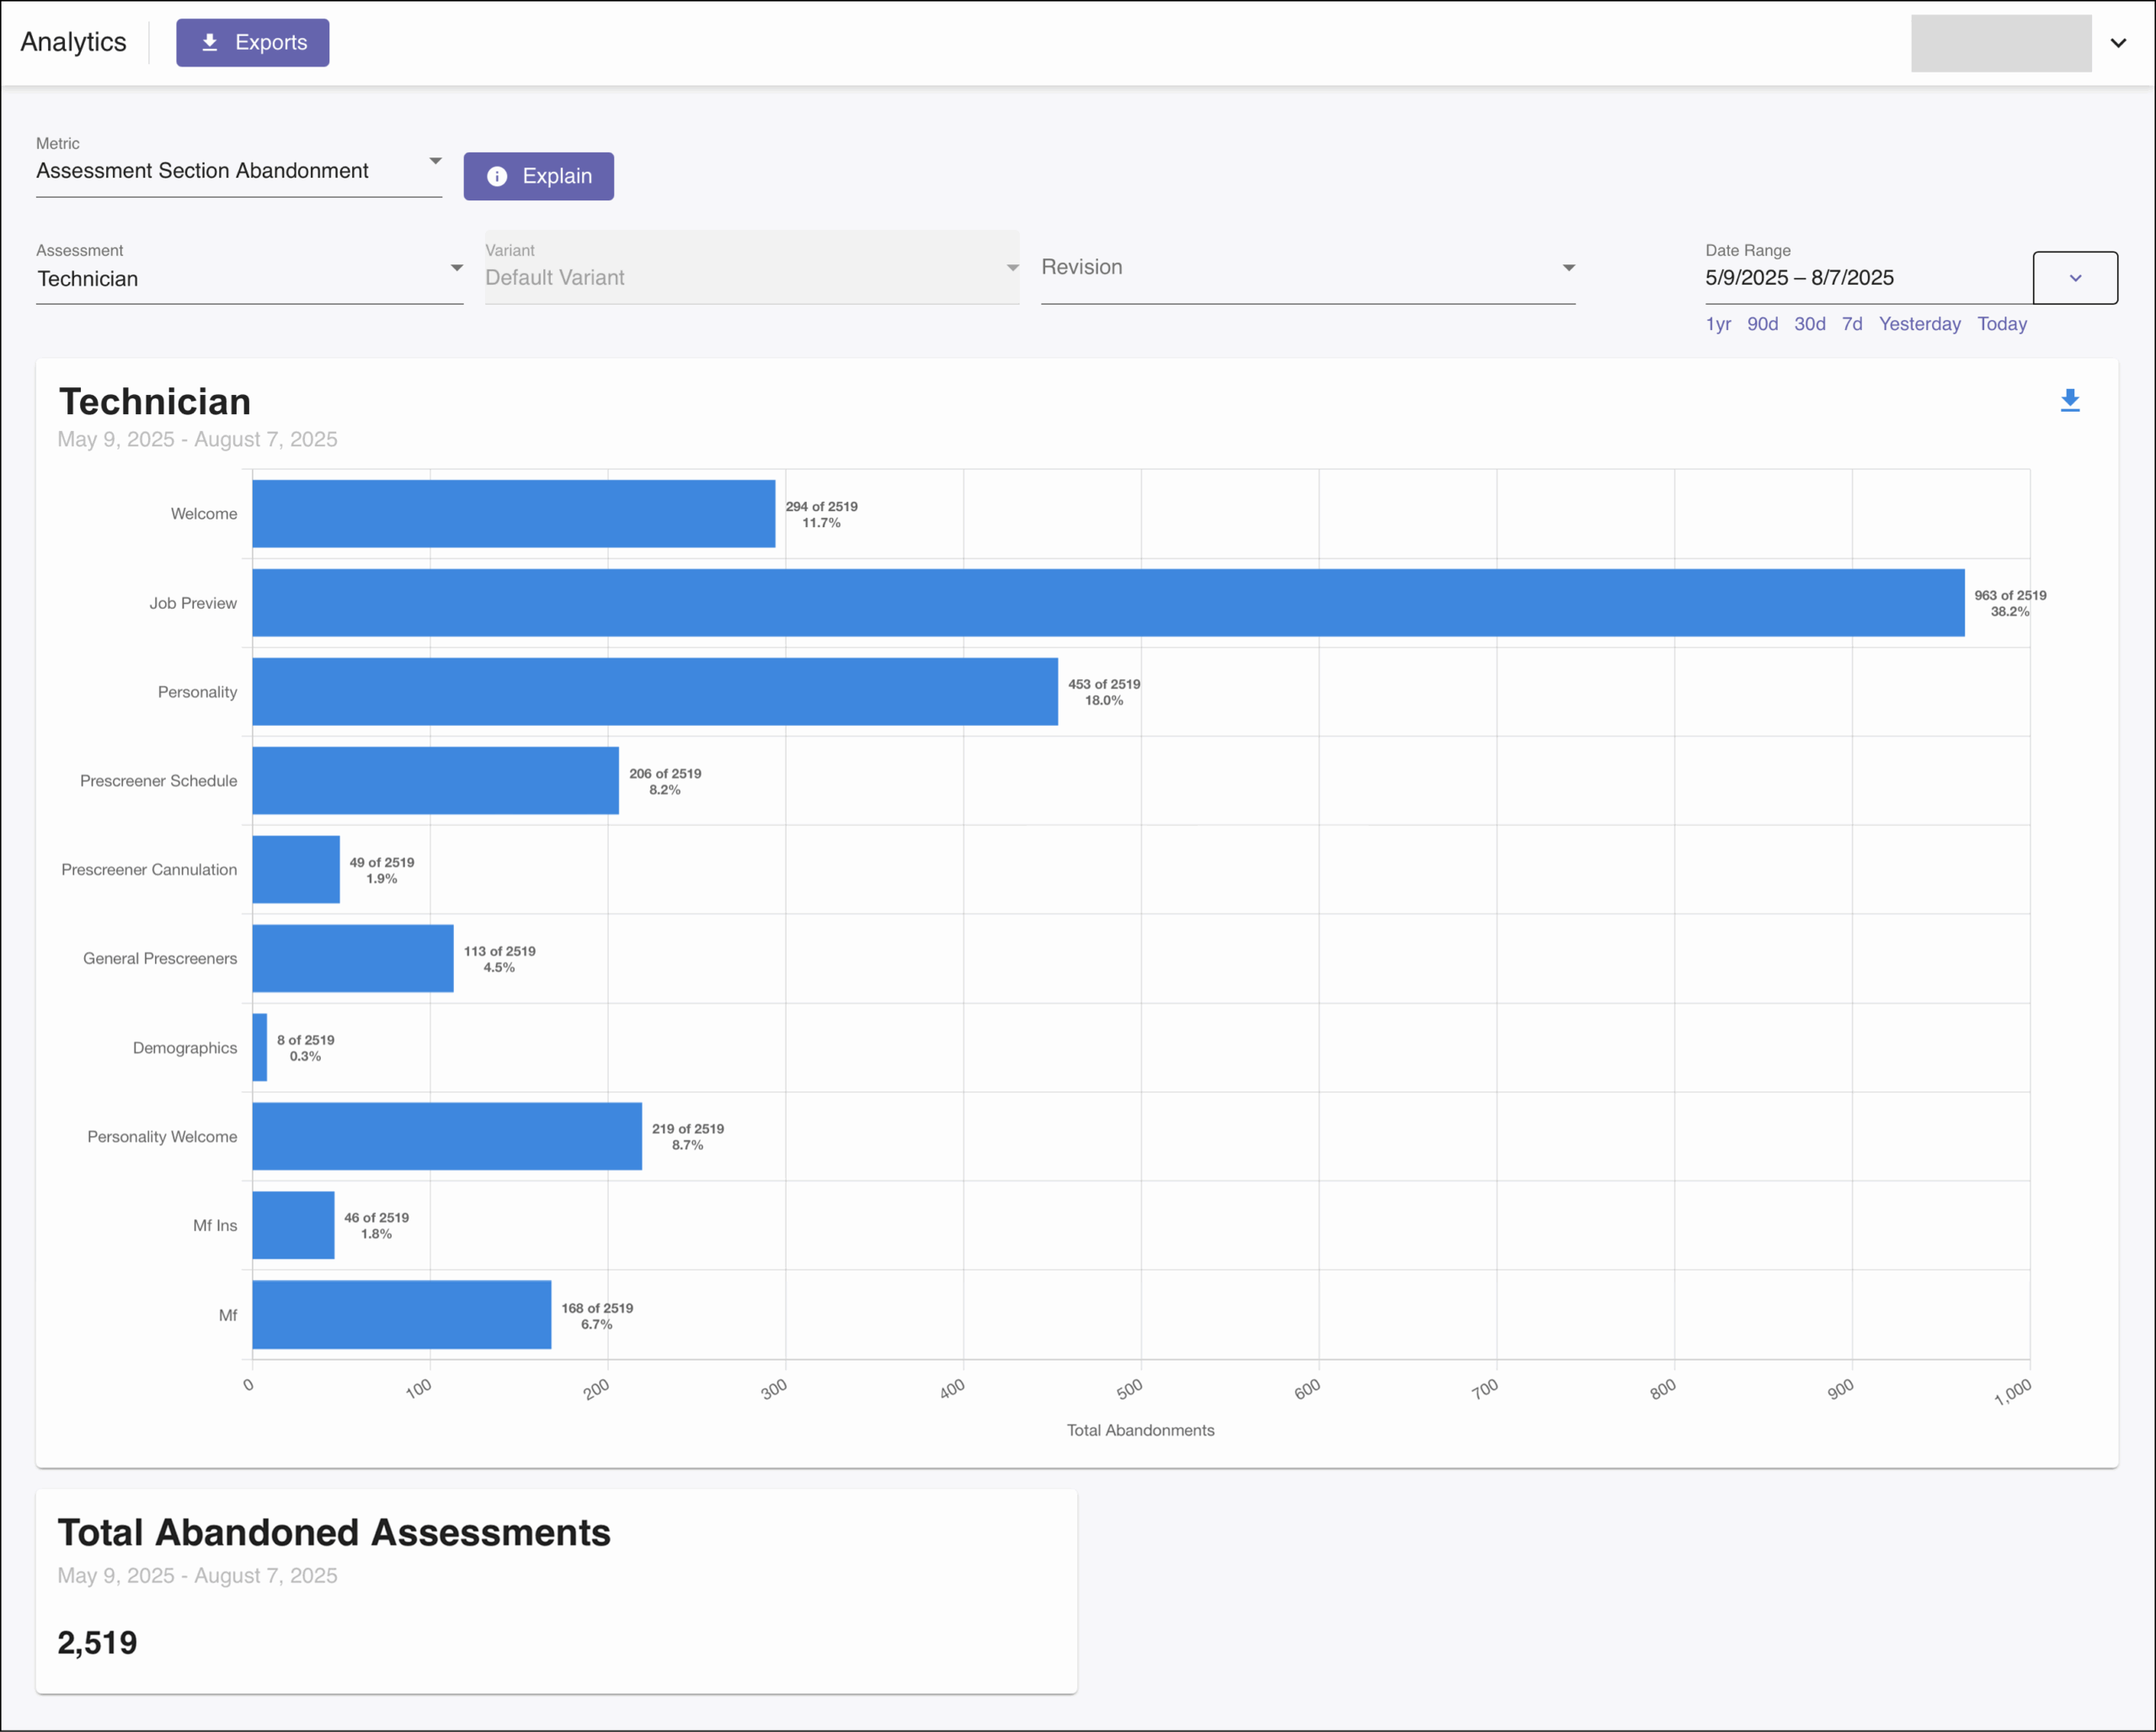
This article covers the Assessment Section Abandonment section in the Analytics tabs in the HighMatch app.
You can pinpoint exactly where candidates drop out within an assessment. This metric highlights abandonment by section, helping you refine specific areas that may be causing candidates to disengage.
This section is one of six metric sections in the Analytics tab.
If you would like more information on any of the other sections, please click on any of the following links:
- Assessment Engagement & Scores
- Assessment Completion Time
- Assessment Section Completion Time
- Invitation Engagement
- Report Engagement

Metric Summary & Data Points
This metric presents a bar chart visualizing where participants exit before completing an assessment. It highlights drop-off points across different sections within an assessment.
Definitions of the data points presented in this metric include:
- Abandonment: A participant exits the assessment and does not complete it.
- Bar Chart: Provides a count in each section in the assessment where a participant exited an incomplete assessment.
A summary card is also available below the bar chart illustrating the total number of abandonments in the assessment.
How to Access & Use
To access this metric:
- Log in to your HighMatch account.
- Click the Analytics tab on the side menu located on the left-hand side of the screen.

- Click the Metric drop-down menu > Select Assessment Section Abandonment.

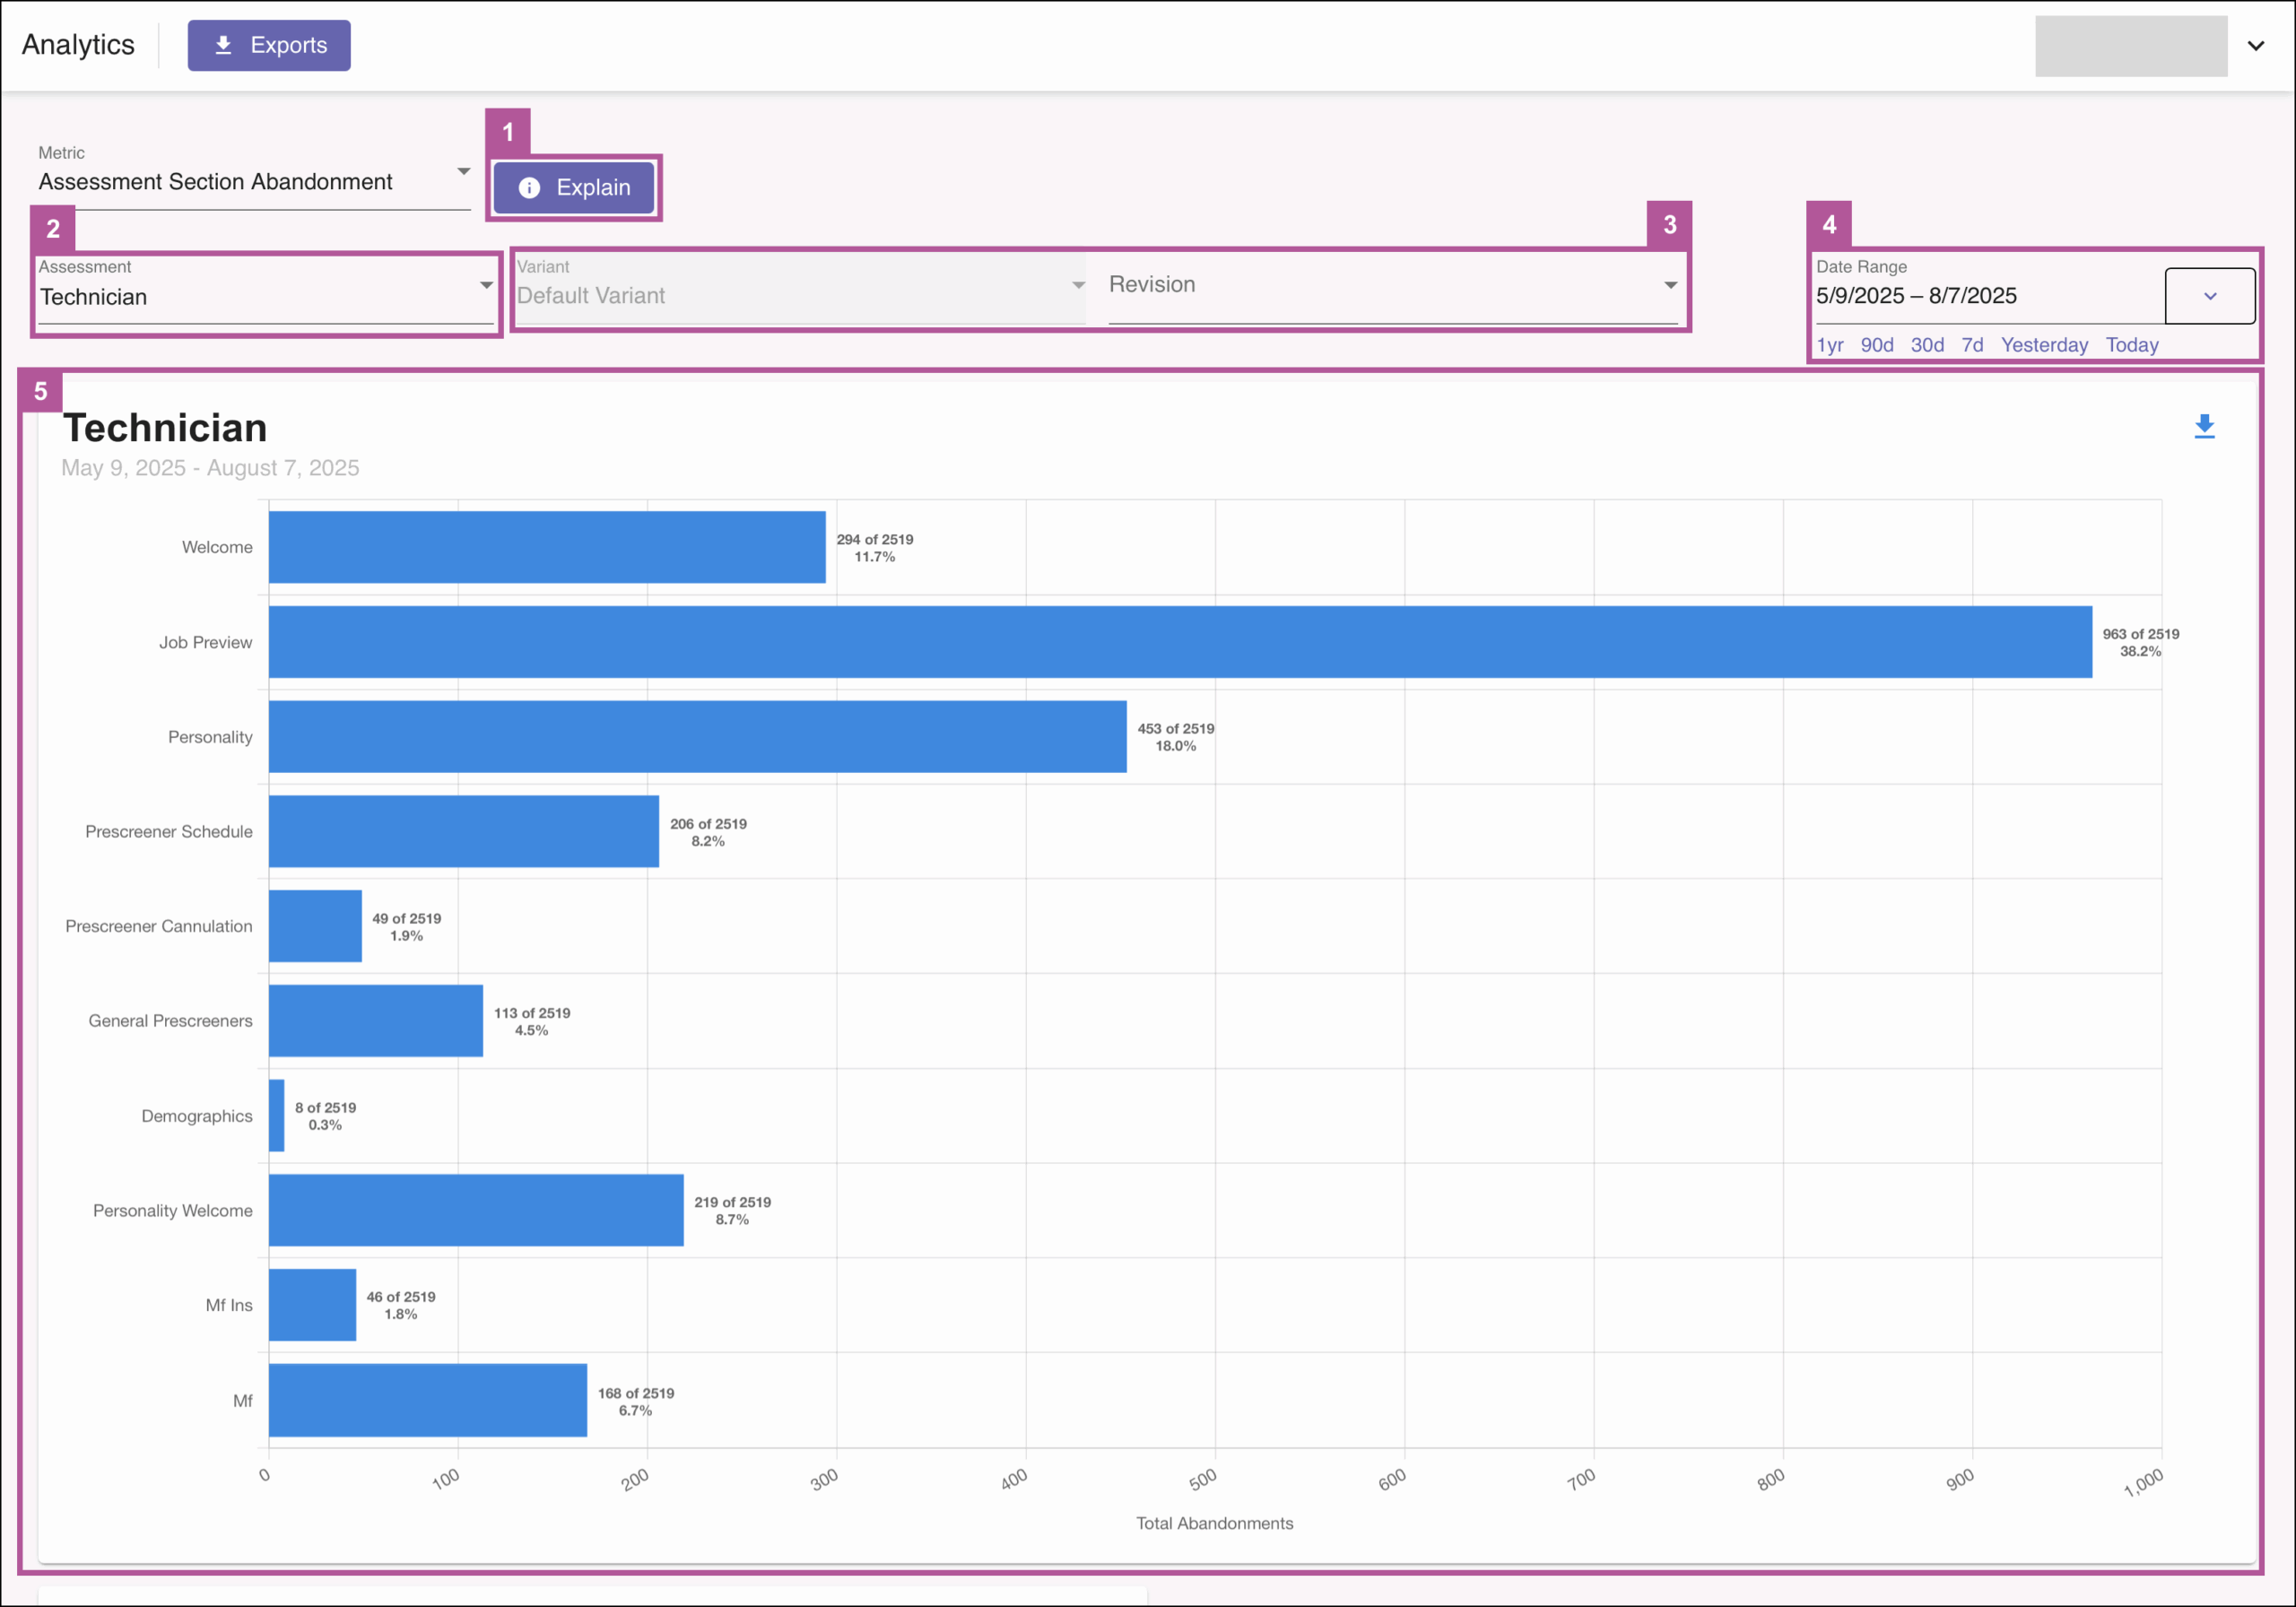
Here you will have several options to view, filter, and download data:

- Explain: Clicking the Explain button will display a metric summary and data points definitions similar to the Metric Summary & Data Points section above.
- Assessment: Allows you to select and filter by individual assessments.
- Variant and Revision: If you have an assessment with variants or your assessment received revisions, you may click any of the drop-down menus to view data for a specific variant/revision.
- Note: It is common for assessments to receive revisions every three to six months. Please check the Revision field before you export your data to ensure you are downloading the correct version.
- Date Range: Provides several options to filter the data by any date range:
- Text field: Here you may enter the date range manually.
- Quick Select: Below the text field, quickly filter by selecting one of the preselected data ranges.
- Relative to Today & Fixed Date Spans: Click the drop-down menu arrow to filter:
- Relative to Today: Select the amount of time to sort relative to the present day.
- Fixed Date Spans: Select one of several preselected and fixed date spans.
- Bar Chart Filters: You are given one option to view data on the chart.
- Hover: Hovering over any of the points on the y-axis on the chart will highlight the specific data for the specific point on the y-axis.
Exporting Data:
There are two ways to export data:

- Analytics | Exports: Clicking the Exports button will take you to the main export page, where you may export several types of data.
- Download (Chart): Clicking the Download icon on the bar chart will allow you to:
- Copy Chart to Clipboard: Allows you to copy the image of a chart and paste it into any document.
- Download Chart Image: Allows you to download an image of a chart.
- Download Chart Data as CSV: Allows you to download the data from a chart in a CSV file.